

Behavioural Insight: Referendum Predictions
Dr Mike Warren shares insight from his 25 years of experience helping people manage their careers better. He makes a prediction based on behavioural psychology:
We all know that it is extremely difficult to predict the behaviour of an individual, but that it is much easier to predict the behaviour of large groups.
Well, I have a prediction for you. The result of the forthcoming referendum on the UK’s continued EU membership will be as follows:
56.4% ± 2.4% for staying in
43.6% ± 2.4% for leaving
Will the outcome be decided by political persuasions? My answer is an emphatic “no”. What makes me say that? In my view it will be nearly all to do with human nature and very little to do with politics. The result will be a simple expression of the very complex interaction between human behaviour and people’s personality styles.
I appreciate that you can make a case for any argument using statistics but try the following logic as a scenario! It is based on two pieces of information, first, my recollections of a lecture I heard many years ago and secondly, the results of a survey of the personality styles of my company’s clients taken over the last 25 years.
The Lecture:
The lecture was an extramural business seminar on “The natural behavioural tendencies of different personality styles”. It was given by a successful American businessman, Dr Robert A Rohm, about 20 years ago. His themes were very wide ranging, but in the context of the forthcoming referendum I will focus on his ideas related to “change” and “risk”.
In this context one of his main theses was as follows: The majority of people don’t like change imposed on them: you have to do it very carefully, gradually and thoughtfully.
At the time I was struggling with the transition from Windows 3.2 to Windows 95 and I could really identify with what he was saying!
Looking back at the notes I made at the time, the main message I gleaned from his talk was that humanity falls into four basic groups:
Group 1: people in this group are generally very risk averse and don’t like change at all, preferring things to stay the same to the point that they generally find it quite difficult to cope with anything that changes.
Group 2: the second group of individuals prefer not to take risks and generally don’t feel comfortable with change either, but if and when it happens they can usually cope with it to varying degrees.
Group 3: people in this group will usually take some risks and they are often comfortable with some aspects of change: they find it exciting and the surprise element gives them quite a buzz.
Group 4: these individuals welcome risk and they like change: to them, risk and change are viewed as challenging and that’s what they like – plenty of challenge: they usually feel better if their lives contain elements of both.
The Survey:
Since the founding of the Career Management Services offered by Proteus Consultancy Limited over 25 years ago we have conducted over 2800 psychometric tests in order to help our clients to define the most viable, realistic and appropriate Career Objectives for their particular personality style.
From the results of these profiles it is possible to allocate them to the four groups above. The percentages we found together with some of the behavioural traits that characterise each group are as follows:
Group 1: 34% Supportive, Stable, Steady, Status quo. They like teamwork, cooperation, collaboration, routine: they like things to stay the same.
Group 2: 24% Cautious, Competent, Conscientious, Careful. They like logical facts, established patterns, continuity, clear information: they like to finish what they start.
Group 3: 28% Interested, Impressionable, Illogical, Involved. They like to share, to be recognised, to be centre stage, to express themselves: they like fun.
Group 4: 14% Dominant, Decisive, Determined, Defiant. They like new ideas, a fast pace, being number one, defining their own rules: they like to plan for the future.
The Vote:
From Dr Rohm’s work we know how each group is likely to respond to change that is imposed on them. But let’s flip the information and ask a different question, because in a referendum the whole point is to give people a choice. The question then becomes. Given the behavioural characteristics outlined above for each of the four groups, how do we think they would naturally tend to vote?
Group 1: Most probably, given the way they prefer to behave they will not vote for change at all, so 100% for staying in. Even if some of them do believe the “Out Campaign” message the percentage is likely to be quite small – let’s say only 10% to 30% voting against their nature – so the majority of 70% to 90% will be in favour of staying in.
Group 2: This group will probably prefer no change, but may be more persuadable than group 1. This suggests that maybe 80% will naturally vote to stay in with perhaps 30% to 50% would vote against their nature – so this group is again largely in favour of staying in but by a lower margin of 50% to 70%.
Group 3: These people may be more amenable to change but are probably the least predictable group, but broadly it suggests that by nature thay are the complete opposites of Group 2 with 80% of them preferring change. Let’s assume then that 50% to 70% will stick with their natural style and go with change leaving 30% to 50% voting to stay in.
Group 4: The individuals in the final group will naturally vote for change: it’s challenging so why not! Therefore they are likely to be 100% for voting out. Even if they are influenced by the “Stay Campaign”, most will still resist and so s many as 70% to 90% will still say “we want out”, meaning only around 10% to 30% will vote to stay in.
The Summary:
Let’s summarise the results and have a look at the influence of political persuasion on the natural voting tendencies of the different personality styles. We consider four different scenarios, no political influence, small political sway, medium political sway and large political sway on the degree to which people’s natural views may be moderated. We can then add up the percentages for all groups: the percentages given are for staying in.
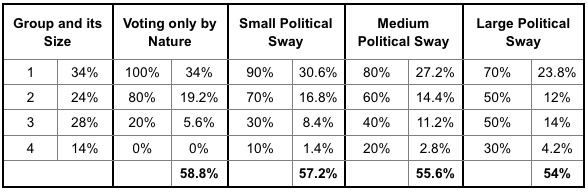
As we see the results vary from 58.8% to 54% wishing to keep the status quo and voting to stay in, giving 41.2% to 46% wishing to leave.
56.4% ± 2.4% for staying in
43.6% ± 2.4% for leaving
It’s not a particularly rigorous analysis but it does show that certainly when it comes to resistance to change, human nature is very difficult to overrule – even by politicians! All we have to do now is to wait for the actual result!
If you’d like to know which group your natural behavioural style puts you in, then please contact [email protected].


